



Measure signal-based outreach by tracking how many relevant accounts become useful conversations and qualified meetings, then compare that progress with the time and money spent finding them. Define each stage before the campaign starts. Otherwise a larger contact list, a different reply definition, or a longer observation window can make a weak campaign look better.
A signal can improve the reason for outreach without improving the economics of the campaign. Research takes time. Some interesting signals turn out to be stale, and some replies are corrections rather than sales interest. Your measurement should make those losses visible.
Choose an account-level view and keep the denominator stable
For this guide, count unique companies, not messages or individual contacts. An account is reached when at least one outreach email is reported delivered; delivery does not prove that a human read it. Keep contact-level delivery and bounce reporting separately. If you use several channels, define and record each channel’s equivalent instead of mixing unlike events.
Count an account once per stage in a campaign. Three contacts at one company should not become three opportunities. Keep campaign membership stable and record the first outreach date so every account gets the same amount of time to produce an outcome.
| Metric | Definition or calculation |
|---|---|
| Signal acceptance | Accounts passing research checks ÷ accounts researched |
| Positive reply rate | Reached accounts with explicit relevant interest ÷ accounts reached |
| Meeting booking rate | Reached accounts with a meeting booked ÷ accounts reached |
| Qualified meeting yield | Reached accounts with a qualified meeting held ÷ accounts reached |
| Cost per qualified meeting | Campaign research, outreach labor, and allocated tool cost ÷ qualified meetings held |
Define a positive reply with examples your team agrees on. ‘Send the checklist’ is interest in a resource; you can track it separately from willingness to discuss a project. An out-of-office message, an unsubscribe, and ‘wrong person’ are not positive replies. A referral becomes sales interest only when the referred person engages.
Use a worked funnel to expose the drop-offs
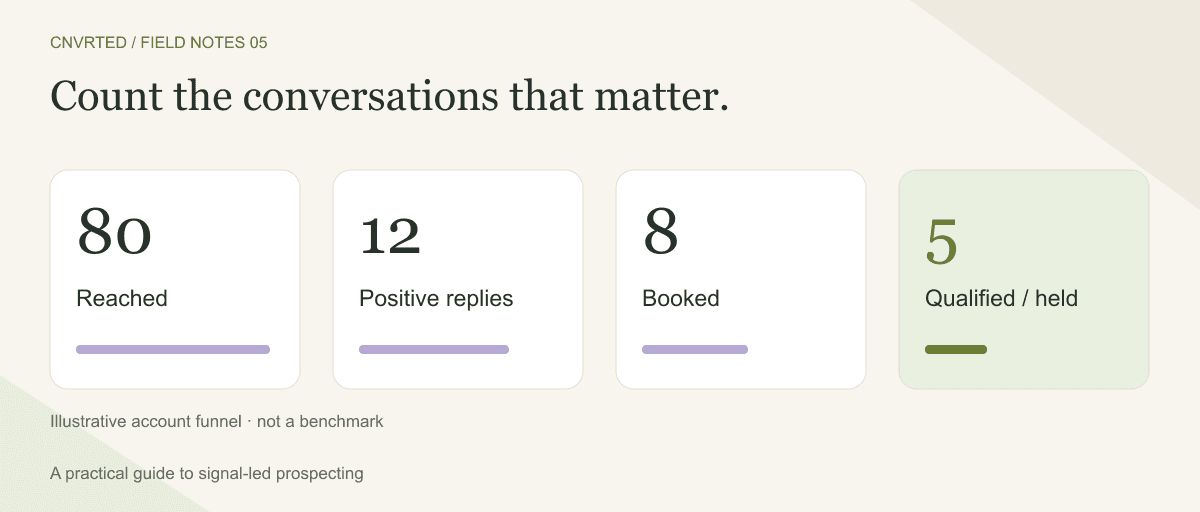
The following numbers are a fictional example, not Cnvrted customer results or industry benchmarks. A campaign researches 120 accounts, accepts 90, and reaches 80. Twelve accounts express relevant interest, eight book a meeting, six attend, and five meet the team’s qualification definition.
| Measure | Calculation | Result |
|---|---|---|
| Signal acceptance | 90 ÷ 120 | 75% |
| Positive reply rate | 12 ÷ 80 | 15% |
| Meeting booking rate | 8 ÷ 80 | 10% |
| Meeting attendance | 6 ÷ 8 | 75% |
| Qualified meeting yield | 5 ÷ 80 | 6.25% |
Suppose research and outreach take 18 hours at an internal cost of $40 per hour, plus $80 in allocated tool costs. Total campaign cost is $800. Dividing by five qualified meetings gives $160 per qualified meeting. Include time spent rejecting the other accounts; excluding that work would understate the cost of the method.
If no qualified meetings occur, report zero meetings and the cost incurred. Cost per meeting is undefined, not $0. Track proposals, won revenue, and delivery margin as later outcomes when enough time has passed, rather than assigning speculative revenue to every booked call.
Decide what makes a meeting qualified
Use criteria a colleague can apply to the meeting notes: the account fits the service, a relevant problem is confirmed, someone can explain how a change would be evaluated, and there is an agreed next step. You may need stricter criteria for your sales model. Record the reason when a held meeting does not qualify.
Keep ‘booked,’ ‘held,’ and ‘qualified’ as separate stages. If bookings are healthy but attendance is weak, inspect expectations and scheduling. If people attend but describe a different problem, revisit your signal interpretation and qualification process. Those problems require different fixes.
Compare similar groups before crediting the signal
Compare campaigns with similar buyer profiles, offers, channels, senders, and observation windows. Record differences you cannot control. A founder contacting warm introductions should not be compared directly with a new salesperson emailing unfamiliar accounts. If you change the offer and the signal together, the result describes the whole play, not the isolated effect of the signal.
Small batches are useful for finding operational problems, but a few additional replies do not establish a reliable lift. Report the underlying counts alongside percentages and repeat the observation. More persuasive evidence comes from comparable cohorts and consistent outcomes over time, with selection differences acknowledged.
Treat opens as a diagnostic, not the outcome
Mailchimp explains that open tracking depends on images, while bot activity and privacy features can distort open and click measurements. An apparent open does not establish human interest. Use those metrics cautiously when investigating delivery or messaging; prioritize actual replies and verified sales stages when evaluating the campaign.
Run a weekly decision review
- Check which signal sources produced accepted accounts and why others were rejected.
- Read a sample of positive, negative, and misclassified replies rather than trusting labels alone.
- Review no-shows and unqualified meetings separately.
- Reconcile research hours, outreach time, and allocated tool costs.
- Choose one change to test next and write down what result would justify keeping it.
Apply this measurement plan to the agency outbound plays or the first B2B customer workflow. Judge each by the conversations and work it creates, with the effort required included.